rapunzl logo green investing castle
Request Free DemoFree Demo
rapunzl mobile hamburger icon
Rapunzl
Educators
Districts
After-School
Parents
Courses
Investment Simulator
Teacher Portal
Integrated Curriculum
Real-Time Market Data
Certifications
Partners
About Us
Blog
Contact
Simulator Login
Educator Login
Get Free Demo
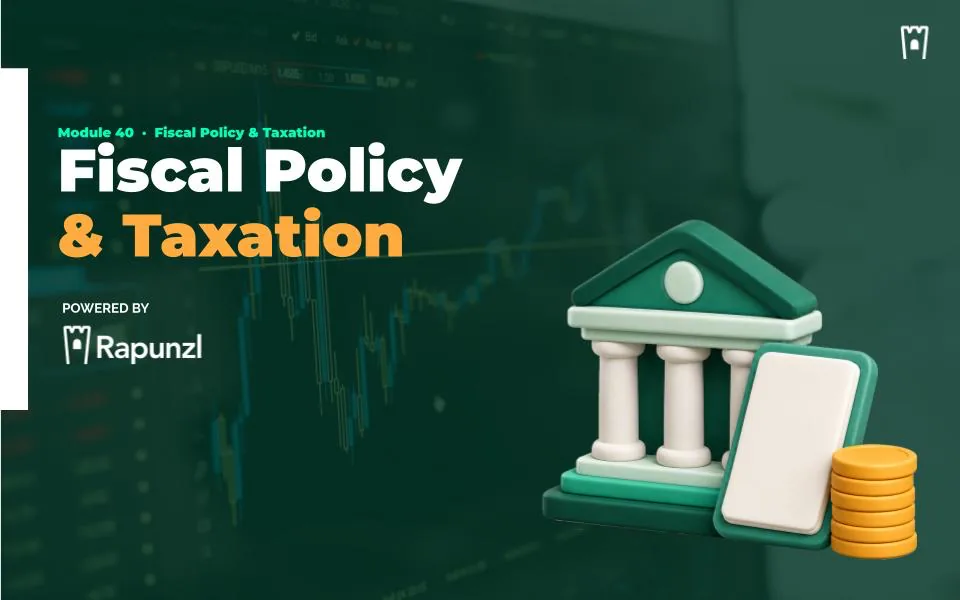
Fiscal Policy & Taxation cover graphic for the Rapunzl economics curriculum
Module 40

Fiscal Policy & Taxation

This economics module explains how governments use spending and taxation to influence output, employment, prices, and long-term public debt.
Students compare tax structures, evaluate expansionary and contractionary fiscal policy, and trace how budget deficits are financed through Treasury securities and accumulated into the national debt.

Module At A Glance

Grade Levels:
9th - 12th
Est. Length:
1-2 Weeks (34 slides)
Activities:
6 Activities
Articles:
0 Articles
Languages:
English & Spanish
Curriculum Fit:
Math, Business, Economics, CTE, Social Studies
Standards Alignment:
CEE National Standards
magnifying glass with stock chart

Guiding Questions

  • What is fiscal policy, and why were the WPA and CARES Act adopted during economic crises?
  • How do changes in income taxes and business profit taxes affect consumer spending and producer investment?
  • What different types of taxes can governments use, and what activities or assets do they tax?
  • How do progressive, proportional, and regressive taxes affect low- and high-income households differently?
  • When should an economist recommend expansionary fiscal policy instead of contractionary fiscal policy?
  • What is the difference between a balanced budget, a deficit, a surplus, and the national debt?
  • How does the government finance deficits by selling Treasury bills, notes, and bonds?

Enduring Understandings

  • Fiscal policy uses government spending and taxation to influence output, employment, and prices across the economy.
  • Taxes change incentives for consumers and producers, affecting household spending, business investment, hiring, and expansion.
  • Governments can tax income, consumption, property, production, pollution, imports, wealth, and value added at different stages of production.
  • Tax fairness depends on effective tax rates: progressive taxes take a larger share as income rises, while regressive taxes take a larger share from lower-income households.
  • Expansionary fiscal policy can fight unemployment by increasing spending or lowering taxes, but it can also put upward pressure on prices and interest rates.
  • A deficit is one year's budget shortfall, while the national debt is the accumulated result of past deficits and surpluses.
  • Treasury securities allow the federal government to borrow when spending exceeds revenue, and higher interest rates raise the cost of new borrowing.

Module Vocab & Key Topics

Fiscal Policy
Government decisions about spending and taxation that are used to influence economic output, employment, prices, and overall demand.
Government Spending
Money the government uses to buy goods and services, fund programs, hire workers, make transfers, or respond to economic crises.
Taxation
The process by which governments collect revenue from households, businesses, transactions, property, imports, pollution, or wealth.
Income Tax
A tax on wages, salaries, business income, investment income, or other earnings received by people or organizations.
Corporate Tax
A tax on business profits that can affect how much firms keep for investment, hiring, expansion, or distribution to owners.
Sales Tax
A consumption tax added to the price of goods or services at the point of purchase.
Property Tax
A tax based on the assessed value of land, buildings, homes, or other taxable property.
Value-Added Tax (VAT)
A tax collected on the value added at each stage of producing and selling a good or service.
Excise Tax
A tax on producing, selling, or using a specific good or activity, sometimes used to raise revenue or discourage consumption.
Pollution Tax
A tax on emissions or environmentally harmful activity intended to make polluters account for social costs.
Tariff
A tax on imported goods that raises the cost of foreign products and can affect trade, consumers, and producers.
Wealth Tax
A tax based on the total value of assets a person owns, rather than only on income earned during a year.
Effective Tax Rate
The share of income actually paid in taxes, calculated by dividing taxes paid by income.
Progressive Tax
A tax that takes a larger share of income as income rises, so higher-income households pay a higher effective rate.
Proportional Tax
A tax that takes the same share of income at every income level, often called a flat tax.
Regressive Tax
A tax that takes a larger share of income from lower-income households than from higher-income households.
Expansionary Fiscal Policy
Fiscal policy that increases government spending, lowers taxes, or both to raise demand, output, and employment in the short run.
Contractionary Fiscal Policy
Fiscal policy that lowers government spending, raises taxes, or both to cool inflationary pressure and slow demand.
Balanced Budget
A budget outcome where government revenue equals government spending for a given year.
Budget Deficit
A budget outcome where government spending is greater than revenue, requiring borrowing to cover the shortfall.
Budget Surplus
A budget outcome where government revenue is greater than spending, allowing the government to reduce borrowing or pay down debt.
Treasury Securities
Debt instruments such as Treasury bills, notes, and bonds that the federal government sells to borrow money from investors.
Treasury Bills
Short-term Treasury securities used by the federal government to borrow money for periods of one year or less.
Treasury Notes
Medium-term Treasury securities used by the federal government to borrow money for periods longer than bills but shorter than long-term bonds.
Treasury Bonds
Long-term Treasury securities used by the federal government to borrow money and pay investors interest over many years.
National Debt
The accumulated total of past government deficits and surpluses, representing how much the government owes over time.


Worked Examples

Fiscal Policy In Action

Four numbers behind what the government spends and taxes.

Figures current · August 2026

Spending multiplier

One Dollar, Several Dollars of Activity

multiplier = 1 ÷ (1 − MPC)MPC = 0.80

A stated marginal propensity to consume of 0.80: every dollar received sends 80 cents back out as new spending. So $1 of government spending becomes $0.80 for the next household, then $0.64, then $0.51 — a shrinking geometric series that sums to 1 ÷ (1 − 0.80).

$5.00of activity per $1 spentmultiplier = 5 at MPC 0.80

$1.00 · initial dollar$1.00 · initial dollar$1.80 · through round 2$1.80 · through round 2$2.95 · through round 4$2.95 · through round 4$5.00 · total activity$5.00 · total activity

Each round re-spends 80% of the last, so one dollar compounds into five dollars of activity — the multiplier is just the sum of a shrinking geometric series.

Deficit vs debt

A Flow and a Stock

debt = Σ deficitₜevery past year, summed

The FY2025 federal deficit was about $1.8 trillion — one year's outlays ($7.0T) minus receipts ($5.2T). That shortfall is a flow. The national debt is the stock it feeds: every past deficit added together, now near $40 trillion (U.S. Treasury, August 2026).

$1.8TFY2025 deficit — one year's shortfalldebt: about $40T

FY22FY24now$1.8T$40Tdebt (stock)deficit (flow)~$40T~$40T

The deficit is a flow measured per year and the debt is the stock those flows sum to, so the debt rises in every year the deficit is positive — even as the yearly shortfall barely changes.

Tax structures

Progressive, Flat, Regressive

average rate changes with incomeup, flat, or down

Three stated schedules, each an average tax rate on income. A progressive tax runs 6% at $30,000 and 24% at $150,000; a flat tax is 15% at every income; a regressive one falls from 10% to 4% as income rises, the way a sales tax does against income. Illustrative rates.

24%high earner's average rate, progressiveflat 15% · regressive 4%

ProgProg · $30k → 6%$30k → 6%ProgProg · $150k → 24%$150k → 24%FlatFlat · $30k → 15%$30k → 15%FlatFlat · $150k → 15%$150k → 15%RegrRegr · $30k → 10%$30k → 10%RegrRegr · $150k → 4%$150k → 4%

A structure is defined entirely by the slope of its average rate against income — rising, flat, or falling — not by the dollars it collects.

Laffer curve

When Higher Rates Raise Less

revenue = rate × base(rate)base shrinks as rate rises

A conceptual shape, not a measurement. Let the taxed base shrink as the rate rises — here linearly to zero at a 100% rate. Then revenue = rate × base traces an inverted-U: zero at 0%, zero at 100%, highest between. This stated model peaks at 50%; a real economy's peak is contested.

50%rate of peak revenue in this modelabove it, revenue falls

0%50%100%0maxpeakpeak20%20%80%80%

Revenue is a rate times a base the rate itself shrinks, so the product rises, peaks, then falls — past the peak, a higher rate multiplies a base that is dropping faster.

Sources: U.S. Treasury final Monthly Treasury Statement and CBO Monthly Budget Review for the FY2025 federal deficit of about $1.8 trillion ($7.0T outlays − $5.2T receipts); U.S. Treasury Fiscal Data (Historical Debt Outstanding and Debt to the Penny) for gross national debt of $30.9T at FY2022 year-end rising to $37.64T at FY2025 year-end and about $40.0 trillion as of August 2026. Empirical figures checked 2026-08-24. Cards 1, 3, and 4 use stated, illustrative inputs, and the copy says so.