rapunzl logo green investing castle
Request Free DemoFree Demo
rapunzl mobile hamburger icon
Rapunzl
Educators
Districts
After-School
Parents
Courses
Investment Simulator
Teacher Portal
Integrated Curriculum
Real-Time Market Data
Certifications
Partners
About Us
Blog
Contact
Simulator Login
Educator Login
Get Free Demo
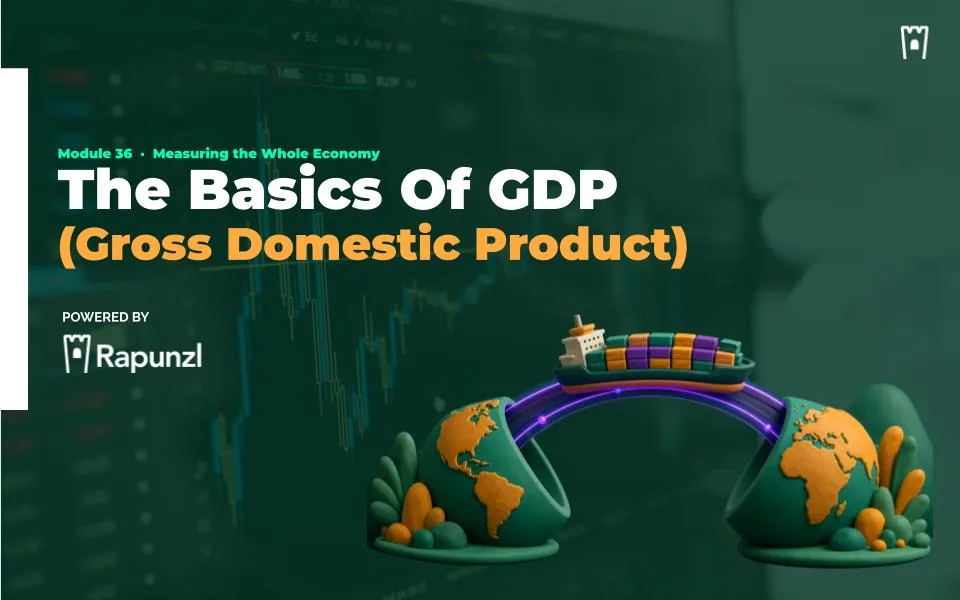
The Basics of GDP cover graphic for the Rapunzl economics curriculum
Module 36

The Basics of GDP

This economics module introduces students to GDP as a tool for measuring the size of an economy and comparing output across time and countries.
Students distinguish nominal from real GDP, calculate real GDP per capita, connect the expenditure and income approaches through circular flow, and evaluate what GDP leaves out.

Module At A Glance

Grade Levels:
9th - 12th
Est. Length:
1-2 Weeks (29 slides)
Activities:
6 Activities
Articles:
0 Articles
Languages:
English & Spanish
Curriculum Fit:
Math, Business, Economics, CTE, Social Studies
Standards Alignment:
CEE National Standards
magnifying glass with stock chart

Guiding Questions

  • How do economists measure the size of an entire economy?
  • Why can nominal GDP rise even when real output does not grow?
  • How does real GDP per capita help compare material living standards over time and across countries?
  • Why do the expenditure and income approaches measure the same GDP?
  • What does GDP miss about environmental quality, income distribution, non-market work, and well-being?
  • What determines an economy's potential GDP over the long run?

Enduring Understandings

  • Gross Domestic Product measures the market value of final goods and services produced within a country during a specific period.
  • Nominal GDP uses current prices, while real GDP holds prices constant to separate actual output growth from inflation.
  • Real GDP per capita is a useful gauge of average material living standards, but averages can hide poverty and unequal distribution.
  • In the circular flow, one person's spending becomes another person's income, so GDP can be measured through expenditures or incomes.
  • GDP is powerful but incomplete because it omits environmental damage, unpaid work, leisure, safety, health, freedom, and many parts of well-being.
  • Potential GDP depends on labor, capital, natural resources, technology, and institutions that shape an economy's long-run productive capacity.

Module Vocab & Key Topics

Gross Domestic Product (GDP)
The total market value of all final goods and services produced within a country's borders during a specific period, usually a year or quarter.
Final Goods and Services
Finished products sold to end users, counted in GDP to avoid double-counting the value of intermediate inputs.
Nominal GDP
GDP measured using current-year prices, so changes can reflect both output growth and price inflation.
Real GDP
GDP measured using constant base-year prices, allowing economists to compare actual production without the distortion of price changes.
Inflation
A general increase in prices that reduces purchasing power and can make nominal GDP appear larger even when output changes little.
Base Year
The reference year whose prices are used to calculate real GDP across multiple periods.
Real GDP Per Capita
Real GDP divided by population, commonly used to compare average material living standards over time or across countries.
Living Standards
The material conditions people experience, often approximated by output or income per person but shaped by many non-GDP factors as well.
Circular-Flow Diagram
A model showing how money, goods, services, and factors of production move between households, businesses, and markets.
Expenditure Approach
A method of measuring GDP by adding spending on final goods and services by households, businesses, government, and foreign buyers net of imports.
Income Approach
A method of measuring GDP by adding income earned from production, including wages, rent, interest, and profits.
Factors of Production
The productive resources used to make goods and services, including labor, land, capital, and entrepreneurship.
Environmental Damage
Harm to natural systems such as pollution, resource depletion, or ecosystem loss that GDP often fails to subtract from measured output.
Income Distribution
The way income is shared across people or households in an economy, which GDP per capita can hide because it is an average.
Poverty
A condition in which people lack enough income or resources to meet basic needs, even in countries with high average output.
Non-Market Work
Valuable work that is not bought or sold in markets, such as caregiving, household labor, and volunteer work, and is usually omitted from GDP.
Well-Being
A broader measure of quality of life that can include health, education, safety, freedom, leisure, environmental quality, and social connection.
Potential GDP
An economy's long-run productive capacity when labor, capital, and other resources are used sustainably and effectively.
Labor Force
The people who are working or actively seeking work, including the skills, education, health, and training they bring to production.
Capital Goods
Tools, machines, factories, infrastructure, and equipment used to produce other goods and services.
Natural Resources
Inputs from nature, such as land, minerals, energy, water, and climate conditions, that can affect productive capacity.
Technology
Knowledge, methods, and tools that allow the same inputs to produce more output or higher-quality goods and services.
Institutions
Rules, laws, property rights, norms, and organizations that shape incentives and help an economy function.
Productivity
The amount of output produced per unit of input, such as output per worker or per hour worked.

Worked Examples

GDP In Action

Four ways to read the single number that sizes an economy.

Figures current · August 2026

The identity

What GDP Adds Up

GDP = C + I + G + NXNX = exports − imports

In 2025, U.S. GDP was $30.8 trillion. Split into the four kinds of spending, consumption alone is $21.0 trillion — about 68 cents of every dollar. Investment and government run near 18% and 17%, and net exports come in at −3%, since the U.S. buys more from abroad than it sells there.

68%of U.S. GDP is consumption (C)I 18% · G 17% · NX −3%

Spending  C · 68%  I · 18%  G · 17%GDP  output · 100%

GDP is a single sum with four addends — consumption, investment, government, and net exports — so every dollar of output ties back to who bought it.

Real vs nominal

Stripping Out Inflation

real = nominal ÷ deflatorbase year = 2017

One economy, measured two ways. Nominal GDP values 2025 output at 2025 prices; real GDP values it against a fixed 2017 base, so only quantities move. From 2019 to 2025 the nominal figure leapt 43%, but real output — what was actually produced — rose just 15%. The rest of the climb was inflation.

+15%real output growth, 2019–2025nominal rose +43% — the gap is prices

201920222025$20T$25T$30Tnominalreal · 2017$

Nominal GDP can rise on higher prices alone, so dividing by a price index is what isolates the real change in output.

Growth rate

Is The Economy Expanding?

g = %Δ real GDPannualized, quarter over quarter

When a headline says "the economy grew 1.5%," it means real GDP, annualized, against the prior quarter. That was the Q2 2026 pace — cooler than the 4.4% of Q3 2025 and the 2.1% of Q1 2026. The rate swings every quarter yet stays positive, so the level of output keeps setting records beneath it.

1.5%real GDP, Q2 2026 (annualized)down from 4.4% in Q3 2025

Q3'25Q4'25Q1'26Q2'2602%4%4.4%4.4%1.5%1.5%

Because growth is a rate of change, GDP can post a record high in the same quarter its growth rate falls — only a negative rate shrinks the level.

Per capita

Output Per Person

per capita = GDP ÷ populationcurrent US dollars

Total GDP tells you which economy is largest; per capita tells you how it feels to live in. Divide each country's 2024 output by its population: the United States made $86,170 per person, China $13,293, and India $2,592 — even though China's economy is the world's second largest overall.

$86,170U.S. GDP per person · 2024China $13.3k · India $2.6k

10³10⁴10⁵India · $2.6kChinaU.S. · $86k

Dividing total output by population turns economic size into output per person, where a giant economy can still land low on the scale.

Sources: U.S. Bureau of Economic Analysis — GDP advance estimates for the 2nd quarter of 2026 (released July 30, 2026) and the 4th quarter and year 2025 (released February 20, 2026); BEA national accounts for expenditure components and annual nominal and real (chained 2017 dollars) levels, retrieved via FRED. GDP per capita from the World Bank, current U.S. dollars, 2024. Retrieved and reviewed August 2026; GDP is revised quarterly.